I had used ELK and GitLab as operational tools at work, but had never set them up from scratch. This gave me the chance to do so.
I have not even used Grafana or Prometheus before, so this installation feels a little different.
0. Install kubectl (link)
1. Install Helm (link)
2. Create an EKS Cluster
bash
root@gphost:~# cat cluster.yml
apiVersion: eksctl.io/v1alpha5
kind: ClusterConfig
metadata:
  name: gp-test
  region: ap-southeast-1
nodeGroups:
  - name: ng-1
    instanceType: t3.medium
    desiredCapacity: 2
    volumeSize: 10
root@gphost:~# eksctl create cluster -f cluster.yml
2022-12-18 10:28:12 [ℹ]  eksctl version 0.122.0
2022-12-18 10:28:12 [ℹ]  using region ap-southeast-1
2022-12-18 10:28:12 [ℹ]  setting availability zones to [ap-southeast-1b ap-southeast-1c ap-southeast-1a]
2022-12-18 10:28:12 [ℹ]  subnets for ap-southeast-1b - public:192.168.0.0/19 private:192.168.96.0/19
2022-12-18 10:28:12 [ℹ]  subnets for ap-southeast-1c - public:192.168.32.0/19 private:192.168.128.0/19
2022-12-18 10:28:12 [ℹ]  subnets for ap-southeast-1a - public:192.168.64.0/19 private:192.168.160.0/19
...
...
2022-12-18 10:46:58 [ℹ]  nodegroup "ng-1" has 0 node(s)
2022-12-18 10:46:58 [ℹ]  waiting for at least 2 node(s) to become ready in "ng-1"
2022-12-18 10:48:11 [ℹ]  nodegroup "ng-1" has 2 node(s)
2022-12-18 10:48:11 [ℹ]  node "ip-192-168-20-2.ap-southeast-1.compute.internal" is ready
2022-12-18 10:48:11 [ℹ]  node "ip-192-168-87-227.ap-southeast-1.compute.internal" is ready
2022-12-18 10:48:13 [ℹ]  kubectl command should work with "/root/.kube/config", try 'kubectl get nodes'
2022-12-18 10:48:13 [✔]  EKS cluster "gp-test" in "ap-southeast-1" region is ready
3. Create an Amazon EBS CSI Driver IAM Role for the Service Account (link)
4. Manage the Amazon EBS CSI Driver as an Amazon EKS Add-on (link)
5. Create PersistentVolumes for grafana, prometheus-server, and alertmanager
6. Add Helm Repositories
bash
root@gphost:~# helm repo add prometheus-community https://prometheus-community.github.io/helm-charts
"prometheus-community" has been added to your repositories
root@gphost:~# helm repo add grafana https://grafana.github.io/helm-charts
"grafana" has been added to your repositories
root@gphost:~# helm repo update
Hang tight while we grab the latest from your chart repositories...
...Successfully got an update from the "grafana" chart repository
...Successfully got an update from the "prometheus-community" chart repository
Update Complete. ⎈Happy Helming!⎈
root@gphost:~#
root@gphost:~#
root@gphost:~# helm repo list
root@gphost:~#
NAME                    URL
prometheus-community    https://prometheus-community.github.io/helm-charts
grafana                 https://grafana.github.io/helm-charts
root@gphost:~#
root@gphost:~# kubectl create ns prometheus
namespace/prometheus created
6. Deploy Prometheus
bash
root@gphost:~# helm install prometheus prometheus-community/prometheus -f values-prometheus.yaml -n prometheus
NAME: prometheus
LAST DEPLOYED: Sun Dec 18 12:59:38 2022
NAMESPACE: prometheus
STATUS: deployed
REVISION: 1
NOTES:
The Prometheus server can be accessed via port 80 on the following DNS name from within your cluster:
prometheus-server.prometheus.svc.cluster.local


Get the Prometheus server URL by running these commands in the same shell:
  export POD_NAME=$(kubectl get pods --namespace prometheus -l "app=prometheus,component=server" -o jsonpath="{.items[0].metadata.name}")
  kubectl --namespace prometheus port-forward $POD_NAME 9090


The Prometheus alertmanager can be accessed via port  on the following DNS name from within your cluster:
prometheus-%!s(<nil>).prometheus.svc.cluster.local


Get the Alertmanager URL by running these commands in the same shell:
  export POD_NAME=$(kubectl get pods --namespace prometheus -l "app=prometheus,component=" -o jsonpath="{.items[0].metadata.name}")
  kubectl --namespace prometheus port-forward $POD_NAME 9093
#################################################################################
######   WARNING: Pod Security Policy has been disabled by default since    #####
######            it deprecated after k8s 1.25+. use                        #####
######            (index .Values "prometheus-node-exporter" "rbac"          #####
###### .          "pspEnabled") with (index .Values                         #####
######            "prometheus-node-exporter" "rbac" "pspAnnotations")       #####
######            in case you still need it.                                #####
#################################################################################


The Prometheus PushGateway can be accessed via port 9091 on the following DNS name from within your cluster:
prometheus-prometheus-pushgateway.prometheus.svc.cluster.local


Get the PushGateway URL by running these commands in the same shell:
  export POD_NAME=$(kubectl get pods --namespace prometheus -l "app=prometheus-pushgateway,component=pushgateway" -o jsonpath="{.items[0].metadata.name}")
  kubectl --namespace prometheus port-forward $POD_NAME 9091

For more information on running Prometheus, visit:
https://prometheus.io/
7. Deploy Grafana
bash
root@gphost:~# helm install grafana grafana/grafana -f values-grafana.yaml -n prometheus
W1218 13:01:12.502934    6566 warnings.go:70] policy/v1beta1 PodSecurityPolicy is deprecated in v1.21+, unavailable in v1.25+
W1218 13:01:13.777265    6566 warnings.go:70] policy/v1beta1 PodSecurityPolicy is deprecated in v1.21+, unavailable in v1.25+
NAME: grafana
LAST DEPLOYED: Sun Dec 18 13:01:11 2022
NAMESPACE: prometheus
STATUS: deployed
REVISION: 1
NOTES:
1. Get your 'admin' user password by running:

   kubectl get secret --namespace prometheus grafana -o jsonpath="{.data.admin-password}" | base64 --decode ; echo

2. The Grafana server can be accessed via port 80 on the following DNS name from within your cluster:

   grafana.prometheus.svc.cluster.local

   Get the Grafana URL to visit by running these commands in the same shell:
     export NODE_PORT=$(kubectl get --namespace prometheus -o jsonpath="{.spec.ports[0].nodePort}" services grafana)
     export NODE_IP=$(kubectl get nodes --namespace prometheus -o jsonpath="{.items[0].status.addresses[0].address}")
     echo http://$NODE_IP:$NODE_PORT

3. Login with the password from step 1 and the username: admin
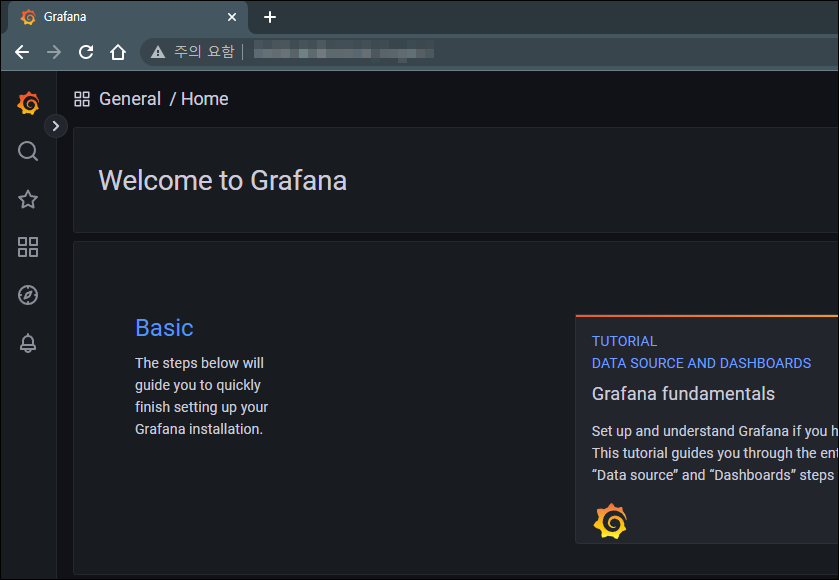
8. Test Access
9. Troubleshooting
Creating EBS volumes felt tedious, so I created the resources in just one Availability Zone. The cluster did not automatically handle mounting them, though. I therefore created plenty of EBS volumes in the Availability Zones where the nodes were located. Each service also required a different volume size. I think Grafana needed a 100GiB volume, but I had created 10GiB EBS volumes, which seems to have prevented it from starting. In any case, resolving the EBS volume issues was enough to get it working.